
What
How could we make the “Coverage and Benefits” pages of our member website more usable and useful? This section was at the heart of our business, representing some of UPMC Health Plan’s most important and popular content. And now we had a chance to improve it.
Highlights
4 pages reorganized and streamlined into 1
Improved impressions of usability, as measured by System Usability Scale survey responses
Success in usability testing for priority tasks
Set the stage for information architecture changes that boosted findability by as much as 57 percentage points
My Collaborators
Jason Kakte [Product manager], Jaclyn Dean [Scrum master], Manoharre Bommu [Engineer], Caleb Smith [Lead engineer], Carol Esterline [Engineer], Jacky Ifft [Visual designer]
My Contributions
Content strategy, Information architecture, Interaction design, Interviewing, Needfinding, Usability testing, User Research, Visual design
Why
This portfolio entry illustrates a piece of a larger project I worked on in 2017 and 2018. And compared to some of my other projects, I was more exclusively responsible for design decisions you’ll see here.
The assignment was to “modernize” our “Coverage and Benefits” pages on UPMC Health Plan’s member website. But there wasn’t much definition beyond that. Internal stakeholders sensed something could be better about these pages, though they couldn’t say what. Adding to the fuzziness, we were given conflicting directives — redesign “Coverage and Benefits,” yet without making drastic change that would be perceived as out of scope from a larger site modernization initiative.
How
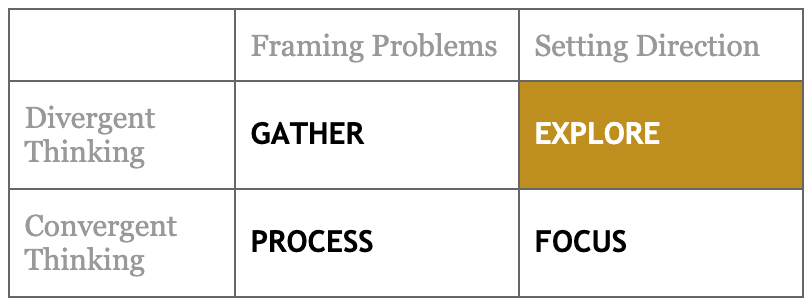
Over the course of this project, Dan Brown’s framework of continuous discovery provides a useful way of mapping my process. First step: Gather.

At the start, we believed it was important to arrive at a concept as quickly as possible. First up was the “Current Plans” page. I inventoried content, assessed the in-production site experiences, skimmed available data, reviewed technical documentation, and interviewed internal SMEs that included technical and member support personnel.

Fig. 1: An assessment of the in-production site experience for a Commercial line-of-business member.

Jumping into exploration, I focused on how the content could be organized and arranged to address the most basic and significant information design issues. And I soon emerged with a higher-fidelity concept we could bring back to the workgroup for discussion, adjustment, and approval. From the beginning, I advocated for taking a mobile-first approach to everything we would do, from initial sketches to final deliverables.

Fig. 2: A low-fidelity arrangement.

Fig. 3: A mobile version of the draft “Current Plans” redesign.
So far, so good. Onto the next page. But the more familiar I became with the rest of the section, the more I realized how misguided it was to fix these pages in a vacuum from each other. I returned to gathering, this time going deeper and broader. At this point, I was constrained from doing any primary user research. So I turned to the best proxies that I could — digging into data that included site analytics and call volumes and trends to member support, and interviewing member support staff about the experiences and interactions of our users.


I identified 6 problems with the section, which pointed to 6 objectives that could reframe our previously fuzzy assignment to “modernize” these individual pages. These included:
Problem: Structure and design are ineffective at helping people understand what plans they have, what benefits are available to them, where they can seek care, and what they’ll pay.
Objective: Make the “Coverage and Benefits” section more plainly understandable, while continuing to provide all the content required either by business request or government regulation.
Problem: Lack of connection between related content means that most pages are dead ends and that members are burdened find what is relevant and needed.
Objective: Connect related content to support findability and discoverability.
Problem: Some services, programs, and benefits receive no mention or are obscure to find.
Objective: Give members a more accurate, complete view of their coverage and benefits.

Fig. 4: Modeling the things represented by our content helped change the way I was thinking about the entire section.

Fig. 5: A visualization used to help stakeholders understand the problems with how things were (left), compared to how they might be (right).
Having illustrated the problem space compellingly and effectively, I was given more room to push for significant changes that would address the new objectives we outlined.


Fig. 6: Sketches of alternative layouts.

Figs. 7: I’ll frequently use a “crazy 8s” approach to generating ideas, this one focused on a piece of navigation and the objectives just for that.

Fig. 8: Getting into mid-fidelity, thinking about how different locations and views relate to each other.
More room to explore also meant more risk, more unknowns. Throughout, I was constantly showing ideas to our engineers for feedback and asking design teammates for critiques. And finally, we were in a position to conduct primary user research. I planned and executed a task-based usability study with a semi-interactive prototype. At its end, the test also included a system usability scale survey.


Fig. 9: A sketch used in conversation with one of our lead developers to help me understand how our data was structured.

Fig. 10: An excerpt of the UI that was a focus of our testing. Would people know to select “Current Active” to switch between past, present, and future plans?
Our usability testing validated that in many ways we were on the right track. It also revealed that users were likely to struggle with certain critical-path controls and that it was worth organizing the plans and benefits pages into a single hierarchical relationship. Which meant I had a little more refinement to do.
Fig. 11: End to end, from early wireframing to final designs.
Fig. 12: Working toward a decision for how to display additional information about a covered member. Options included changing locations, triggering panel overlays, opening a dialog.

Fig. 13: The final, streamlined Plans and Coverage.
Results
Improved impressions of usability.
74.2 was the average score of our system usability scale survey responses, which is considered “good” or “acceptable.” (95% Confidence Interval Minimum: 50.2 | 95% Confidence Interval Maximum: 98.2)
We don’t have an apples-to-apples baseline comparison unfortunately, but overall the member website was averaging SUS scores in the 40s and 50s. Many of these users almost certainly experienced the “Coverage and Benefits” pages prior to redesign.
4 pages reorganized and streamlined into 1.
Success in testing for priority tasks such as determining active plans, determining covered members and finding ID numbers, finding deductible information, and identifying where to find details of ancillary services.
Set the stage for information architecture changes that boosted findability.
First-click success rates increased:
to 81% from 67% for “Where would you expect to find information about your copays for medical services?”
to 97% from 63% for “You want to know if your dental plan is active and who is on it. Where would you look for this?”
to 97% from 40% for “Where would you expect to find digital versions of your member ID cards?”
